

This blog is to make the wider community aware of issues in Azure relating to the use of Log Streaming / Live Analytics from an App Service Plan following the last GUI update (roughly 3 months ago).
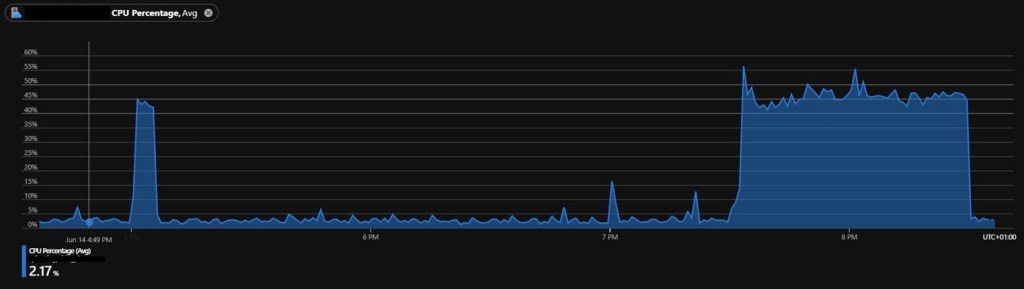
In short, if you use any Log Streaming on your websites / function Apps that are backed by an App Service Plan, you will see a spike of up to 5% per site. In an extreme case where you are maxing out the sites vs worker size, you could see an increase of 50% CPU based off of 0 real activity.
This behaviour has been confirmed by Microsoft and is being investigated internally as the result of a Service Ticket raised in Azure.
This is quite literally the scenario that happened to me. I had an App Service Plan (S2) filled with various sites (19 which is too high for a medium worker) and every time I looked at the logs I saw an immediate spike to 60% CPU from an idle state of 5%. This 55% spike is confirmed by Microsoft to be a result of the Live Streaming taking an additional 3-4% from each site.
If you are seeing similar behaviour, the good news is you dont have poor code or memory leaks (at least not from app startup), but you probably are maxing out your worker size on your App Service Plan and attempting to use Live Metrics from the new GUI.
To mitigate the issue, simply stop using any Live Metrics in Azure that are linked to that App Service Plan. Looking at any site will start it for all sites, which may not be ideal for you.
To mitigate further, consider splitting out your sites into different App Service Plans, i.e. have 2 S1s rather than an S2. You could also look at the consumption or premium consumption for Function Apps, as these don’t seem to be impacted by the same problem.
Hopefully though, Microsoft will simply address the issue and allow us to only start Live Metrics for the site we are looking at, not all sites. But we will wait and see!
